As a specialist in land monitoring and cadastre I always suspected that uncertainty in legal status of the land parcel may provoke illegal dumping at such parcel. One evidence I collected during the study on implementation of high resolution imagery for monitoring of illegal dumping - illegal landfill occurred on the land parcel with no particular legal status. Today I found another one - illegal dump existed for several years because the land parcel owner wasn't determined.
Friday, August 26, 2011
Friday, August 19, 2011
Relation Between Fires and Distanse to the Nearest Highway
Instead of introduction
Just for fun I decided to investigate relationship between fires intensity in Leningrad region (and St. Petersburg as well) and distance to the nearest road in order to gain the evidence of the major influence of the anthropogenic factor on fire starting.
Materials and methods
Data used:
- FIRMS fire data;
- OSM data from GIS-LAB.info.
OSM data about major roads of Leningrad region was used to create a distance map. Distance map and data about locations of the fires detected from 2001 to June 2011 were used as arguments for the R "rhohat" function of "spatstat" package in order to investigate dependence of fires intensity on distance to the nearest highway.
Results and discussion
Firstly lets look at the map of the fires intensity distribution in space below (this map is rough and was created just to demonstrate the situation in general and it wasn't used for the computations described below). Due to usage of the roads at this map will be a hinder for fire data I used railways instead.
 |
| Rough fires intensity distribution in Leningrad region |
As you can see, fires intensity is [somewhat] related to the location of the railways: note that there are almost no fires at the east side of the map where railways net is sparse (north side of the map is similar, but there is Ladoga Lake located). Ofcourse railways are not the cause for the fires by themselves, but I suppose that in this particular case this can be evidence of the significant human influence on the fire events.
I believe you think that if we want to find clear evidence of the human influence on starting fire than we should investigate density of the population and compare it to the fires intensity. Fair enough, but you may do it by yourself using official data if you want. I will not do it because the results will be flawed. There is an issue with population - there is no data for the actual population of Leningrad region in summer (late spring and early autumn as well) time - the time of fires. At this time a lot of people from St.Petersburg go to their summer houses in Leningrad region (take into account that the population of St. Petersburg is 5 times higher than a population of Leningrad region) and you have to estimate population of the region accordingly, and it is far not a trivial task.
So we have to investigate not the population density by itself, but the proximity of the areas that were on fire to the population. We will measure the proximity as a distance to the nearest highway. Ofcourse it is better to use all available roads for such research, but if we will do so, R will calculate it for a very long time (there are over 80 000 features in the shp-file) - I've stopped the process after 10 hours of waiting. So I've used only major highways (with "primary", "secondary", "trunk", "tertiary" and "motorway" attributes in OSM) - over 10 000 features.
rhohat{spatstat} function was used to create the following graph:
 |
| Dependence of the fires distribution on the distance to the nearest highway |
There is an interesting "sinusoid" from 18th to 38th kilometre. Narrow gray stripe demonstrates possible error so I assume that this graph is reliable. I need to explain it somehow. My wife who is better mathematician than I tells that the best explanation is a shitty computation. Well, it is possible. But I have another opinion.
Possible explanations:
- Remember that we left more than 70 000 roads outside our calculations for this graph and there are a lot of roads which are not recorded in OSM. I suppose that if we would use almost complete dataset of roads in Leningrad region and more powerful computer than mine we would have more adequate graph where this sinusoid may disappear.
- Proximity, estimated here is not only a proximity for "occasional fire starters" but also a proximity for fire fighters. If a fire starts far away from the road it is more difficult to fight it. So this is about fire data and how we treat it for the computation: it is possible that fire events are continuously less frequent as we move away from the highway, but single event produce fire which covers larger area than average due to it is hard to fight it quickly, and this single event produce more "hotspots" (which were used for this mini-research) than average event.
Conclusions
We have got a strong evidence that anthropogenic factor plays a major role as cause for fire in Leningrad region: intensity of fires riches its maximum at distance of 2-3 km away from the road and then goes down.
"Sinusoid" between 18th and 38th kilometres may be caused by insufficiency of the road data used. Calculations should be repeated with more comprehensive data. Also it may be necessary to pre-process fire data in order to replace "hotspots" related to a single fire event with the single point i.e. to make it one point for one fire.
UPD: the story continues here.
Wednesday, August 10, 2011
R spgrass6 Library Installation in openSUSE: workaround
I've encountered a problem with connecting R and GRASS in openSUSE to multiply their power. "spgrass6" library was unwilling to install properly. Here is a workaround for this issue.
"spgrass6" needs libxml2-dev (can be found here) package for installation (actually this package is required by "XML" library that needed for "spgrass6") so install it ;-)
If you will try to install "spgrass6" normally (as root), you may receive the message (first two lines of installation logs) that this library will be installed in
Related post: R-commander installation in openSUSE
If you will try to install "spgrass6" normally (as root), you may receive the message (first two lines of installation logs) that this library will be installed in
'/root/R/x86_64-unknown-linux-gnu-library/2.13’ because 'lib' is not defined which means that this library will be available only for root. So you need to perform installation as user and everything will be fine.Related post: R-commander installation in openSUSE
Sunday, August 7, 2011
Climate Change: Mass Killing - Simple And With Impunity
"I have severe doubts that we can support even two billion if they all live like citizens of the U.S. The world can support a lot more vegetarian saints than Hummer-driving idiots."
~ Paul Ehrlich
There is an interesting post about estimated amount of years for each country to cease their green house gases emission. Most of the countries have to do it in the following 10 years... And there are loud words about "climate racism" and "climate genocide" with reference to some Climate Genocide. They asseverate that
"Both Dr James Lovelock FRS (Gaia hypothesis) and Professor Kevin Anderson ( Director, Tyndall Centre for Climate Change Research, University of Manchester, UK) have recently estimated that only about 0.5 billion people will survive this century due to unaddressed, man-made global warming. Noting that the world population is expected to reach 9.5 billion by 2050, these estimates translate to a Climate Genocide involving deaths of about 10 billion people this century, mostly non-Europeans, this including about 6 billion under-5 year old infants, 3 billion Muslims in a terminal Muslim Holocaust, 2 billion Indians, 1.3 billion non-Arab Africans, 0.5 billion Bengalis, 0.3 billion Pakistanis and 0.3 billion Bangladeshis. Already 18 million people die avoidably every year in Developing countries (minus China) due to deprivation and deprivation-exacerbated disease and man-made global warming is already clearly worsening this global avoidable mortality holocaust. However 10 billion avoidable deaths due to global warming this century will yield an average global annual avoidable death rate of 100 million per year"
...errr... SO WHAT?!!!... Look around guys! There are more than 7 billions of us at this poor planet and we are consuming it. More people means need of more resources for food, more fields, more coffins. There is an OVERPOPULATION and you don't have to be genius to notice it! If so called Global Warming or Climate Change will lead to major human population decrease than it's a blessing, not a blight!
Again: "...Climate
Genocide involving deaths of about 10 billion people this century,
mostly non-Europeans...". Of course most of them won't be Europeans! Look at the map (taken form here):
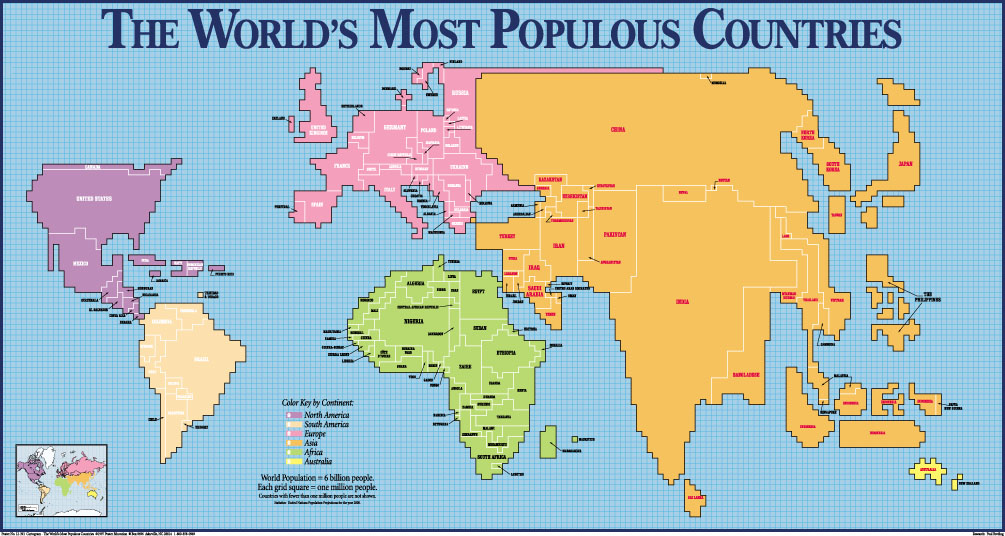 | ||
| Most Populous Countries |
Then take a look at this graph (taken from here):
 |
| World Population Growth for Developing and Industrialised Regions |
Who is responsible for overpopulation? - Developing countries... I assume that it would be not fare if "..the most of them would be Europeans..." If by the end of the century there will only 0.5 billion people remain, than we will just fit to our planet's capacity for the humans (taking into account that some of us consume more than others).
Back to the so called climate change. I'm environmentalist, so I'm pleased that there are a lot of activities about ceasing of the green house gases emission. But on the other hand I'm scientist, not a climate scientist, but environmental one (I'm ecologist and geographer), so I my opinion is that CO2 is not the threat we must fight with. I have some scientific subscriptions and it is always painful for me to see that the major part of the world's environment research are dedicated to this "problem" of climate change. People could do the real job, but it is easier to find founding for the "climate change" research... A fellow misanthrope wrote a nice post about this political game. And you should see the video on that page.
Finally here you are another site of an open-minded person about overpopulation (with some awesome quotes by the way).
P.S. Now I wonder whether I should turn off my computer at night or not... Seems that in the long term it will be better for environment to let it work ;-)
Saturday, August 6, 2011
About Risks
I'm looking for the approaches for the environmental risks estimation at the given area. I have my own ideas for the current task, but it is always interesting to know what other people do.
Today I acquainted myself with a master thesis on a subject of spatial analysis of epidemiology of some disease. I was curious because it was about risk mapping. But I was totally disappointed. The guy didn't mention the definition for the "risk" term he used and it is quite obvious why. Instead of the risk assessment (which implies monetary estimation of the probability of undesired event) he estimated the probability of contracting disease... The thesis is good actually, but the guy did much lesser job than one should when he studies risks.
The same shit exists in Russian legislation. It defines "environmental risk" only as s probability of event that harms environment. So for example if I'm studying risks of the fire at illegal dumps then I can assess just a probability of such events at the given region and don't bother myself with possible damage estimation...
Remember: [Risk] = [Probability] * [Damage]. If you do not estimate damage - you are calculating something else, so name it accordingly.
Wednesday, August 3, 2011
Edit QGIS symbols names in symbology-ng-style.xml
If you will ever edit names of your symbols directly in symbology-ng-style.xml do it via find and replace method, because if symbol has markers, its name will be repeated several times in different parts of the file: for every SVG marker which is used in symbol.
Subscribe to:
Posts
(
Atom
)