What is the cause for the degradation of environment?
Capitalism, corruption, consuming society? - OVERPOPULATION!
Please, save the Planet - kill yourself...

Sunday, December 14, 2014

How to Get Accurate Measurements in QGIS

This post is mainly my answer to the corresponding question.

The main rule for accurate measurements is to define correct CRS for your layers and project. This is somewhat wide theme to talk about so I won't ;-) 

Lets just discuss what you should do when the project CRS can't be easily used for measurement (like Web Mercator) and you want to use Measure tool to calculate distance or area. Go Settings -> Project Properties, in CRS tab enable on the fly transformation; in General tab in Measure tool menu choose ellipsoid for distance calculations. See picture:


When you start measurements with the Measure tool move your cursor over the Measure window - an information about measurement settings will pop up just like that:


Now you can make your measurements and be sure that they are accurate. NOTE that you should always check Measure tool settings like it shown at the picture above because Ellipsoid settings for the Measure tool are not always stored or displayed in Project settings correctly (QGIS 2.6.1).

Sunday, November 30, 2014

A Flawed Research on a TSP Algorithm

A Travelling Salesman Problem (TSP) is a well known computational challenge. A lot of algorithms were developed to solve it or its special cases.

I came around an article authored by Fang Liu 'A dual population parallel ant colony optimization algorithm for solving the travelling salesman problem'. In this article he proposed a modification of an Ant Colony System algorithm for solving TSP and presented results obtained by his algorithm. In the table with results all looked fine - his algorithm was able to provide very good solutions for the TSP instances from TSPLIB (which is the common testing ground for TSP algorithms).

So the researcher presented good results... it seems. But then he decided to show the best routes his algorithm was able to find and annotated them with the corresponding route costs. Lets take a look at one of them. Here you are his best route for the 'att48' instance from the TSPLIB:

Route that claims to be optimal (but the cost is very wrong)
The optimal route for 'att48' and its cost is well-known (it applies to all TSPLIB instanses). Its cost is approximately 33523 (there are different approaches to rounding distances between points). So what we see at the picture above should be the optimal route (or extremely close to it). But dear reader, do you think that you see optimal route? Humans are able to provide very good solutions to TSP instances that consists of not too many points. I bet you can draw far better route yourself. The route from this picture is 1, 8, 46, 33, 20, 17, 43, 27, 19, 37, 6, 30, 36, 28, 7, 18, 44, 31, 38, 9, 40, 15, 12, 11, 47, 21, 13, 25, 14, 23, 3, 22, 16, 41, 34, 2, 29, 5, 48, 39, 32, 24, 42, 10, 45, 35, 4, 26, 1 and its cost is 41052 which is whooping 22% far from optimal! The same story for another illustration in the article.

Here take a look at the optimal route which cost is really 33523:
Actually optimal route for 'att48' with Cost = 33523
So what we can conclude? I do believe that the routes demonstrated in the article are the best routes found by given algorithm, but costs are put-up for the routes and for the table of results in the article as well. I think that author developed an algorithm that wasn't able to find good solutions and provided fraud table with the put-up testing results. And clearly this article wasn't reviewed by scientist that have knowledge in TSP area because these plots are so obviously flawed that one can't overlook it!

No one usually shows plots of the routes they find with their algorithms. I wonder if there are more modern algorithms with the put-up results?

Sunday, November 2, 2014

How to Create Delauney Triangulation Graph from a .shp-file Using NetworkX

For my own project I needed to create a graph based on a Delauney triangulation using NetworkX python library. And a special condition was that all the edges must be unique. Points for triangulation stored in a .shp-file.

I was lucky enough to find this tread on Delauney triangulation using NetworkX graphs. I made a nice function out of it for point NetworkX graphs processing. This function preserves nodes attributes (which are lost after triangulation) and calculates lengths of the edges. It can be further improved (and most likely will be) but even at the current state it is very handy.

Example of use:
import networkx as nx
import scipy.spatial
import matplotlib.pyplot as plt

path = '/directory/'
f_path = path + 'filename.shp'
G = nx.read_shp(f_path)

GD = createTINgraph(G, show = True)


Code for the function:
import networkx as nx
import scipy.spatial
import matplotlib.pyplot as plt

def createTINgraph(point_graph, show = False, calculate_distance = True):
  '''
  Creates a graph based on Delaney triangulation

  @param point_graph: either a graph made by read_shp() from another NetworkX's point graph
  @param show: whether or not resulting graph should be shown, boolean
  @param calculate_distance: whether length of edges should be calculated
  @return - a graph made from a Delauney triangulation

  @Copyright notice: this code is an improved (by Yury V. Ryabov, 2014, riabovvv@gmail.com) version of
                    Tom's code taken from this discussion
                    https://groups.google.com/forum/#!topic/networkx-discuss/D7fMmuzVBAw
  '''

  TIN = scipy.spatial.Delaunay(point_graph)
  edges = set()
  # for each Delaunay triangle
  for n in xrange(TIN.nsimplex):
      # for each edge of the triangle
      # sort the vertices
      # (sorting avoids duplicated edges being added to the set)
      # and add to the edges set
      edge = sorted([TIN.vertices[n,0], TIN.vertices[n,1]])
      edges.add((edge[0], edge[1]))
      edge = sorted([TIN.vertices[n,0], TIN.vertices[n,2]])
      edges.add((edge[0], edge[1]))
      edge = sorted([TIN.vertices[n,1], TIN.vertices[n,2]])
      edges.add((edge[0], edge[1]))


  # make a graph based on the Delaunay triangulation edges
  graph = nx.Graph(list(edges))

  #add nodes attributes to the TIN graph from the original points
  original_nodes = point_graph.nodes(data = True)
  for n in xrange(len(original_nodes)):
    XY = original_nodes[n][0] # X and Y tuple - coordinates of the original points
    graph.node[n]['XY'] = XY
    # add other attributes
    original_attributes = original_nodes[n][1]
    for i in original_attributes.iteritems(): # for tuple i = (key, value)
      graph.node[n][i[0]] = i[1]


  # calculate Euclidian length of edges and write it as edges attribute
  if calculate_distance:
    edges = graph.edges()
    for i in xrange(len(edges)):
      edge = edges[i]
      node_1 = edge[0]
      node_2 = edge[1]
      x1, y1 = graph.node[node_1]['XY']
      x2, y2 = graph.node[node_2]['XY']
      dist = sqrt( pow( (x2 - x1), 2 ) + pow( (y2 - y1), 2 ) )
      dist = round(dist, 2)
      graph.edge[node_1][node_2]['distance'] = dist


  # plot graph
  if show:
    pointIDXY = dict(zip(range(len(point_graph)), point_graph))
    nx.draw(graph, pointIDXY)
    plt.show()

  return graph

Wednesday, October 1, 2014

Interactive Visualisation of the Profitable Amount of Waste to Dispose Illegally

"Wow!" - I said to myself after reading R Helps With Employee Churn post - "I can create interactive plots in R?!!! I have to try it out!"

I quickly came up with an idea of creating interactive plot for my simple model for assessment of the profitable ratio between the volume waste that could be illegally disposed and costs of illegal disposal [Ryabov Y. (2013) Rationale of mechanisms for the land protection from illegal dumping (an example from the St.-Petersburg and Leningrad region). Regional Researches. №1 (39), p. 49-56]. The conditions for profitable illegal dumping can be describes as follows:


Here: k - the probability of being fined for illegal disposal of waste;
P - maximum fine for illegal disposal of waste (illegal dumping);
V - volume of waste to be [illegally] disposed by the waste owner;
E - costs of illegal disposal of waste per unit;
T - official tax for waste disposal per unit.

The conditions for the profitable landfilling can be described as follows:

Here: V1 - total volume of waste that is supposed to be disposed at illegal landfill;
Tc - tax for disposal of waste at illegal landfill per unit;
P1 - maximum fine for illegal landfilling;
E1 - expenditures of the illegal landfill owner for disposal of waste per unit.

Lets plot the graphs (with some random numbers (except for fines) for a nice looking representation) to have a clue how it looks like.


Note that there is a footnote (this post provides nice examples on how to do it) with the values used for plotting - it is important to have to have this kind of indication if we want to create a series of plots.

Now I will show you the result and then will provide the code and some tips.

Playing with the plot

Tips and Tricks

Before I will show you code I want to share my hardly earned knowledge about nuances of the manipulate library. There are several ways to get static plot like that using ggplot, but some of them will fail to be interactive with manipulate.

  1. All the data for the plot must be stored in one dataframe.
  2. All data for plots must be derived from the dataframe (avoid passing single variables to ggplot).
  3. Do not use geom_hline() for the horizontal line - generate values for this line and store them inside dataframe and draw as a regular graph.
  4. To create a footnote (to know exactly which parameters were used for the current graph) use arrangeGrob() function from the gridExtra library.
  5. Always use $ inside aes() settings to address columns of your dataframe if you want plots to be interactive

The Code

library(ggplot2)
library(grid)
library(gridExtra)
library(manipulate)
library(scales)
library(reshape2)

## Ta --- official tax for waste utilisation per tonne or cubic metre.
## k --- probability of getting fined for illegal dumping the waste owner (0 V, y <=> E

max_waste_volume <- 2000 
Illegal_dumping_fine_P <- 300000
Illigal_landfilling_fine_P1 <- 500000
Fine_probability_k <- 0.5
Official_tax_Ta <- 600

# mwv = max_waste_volume
# P = Illegal_dumping_fine_P
# P1 = Illigal_landfilling_fine_P1
# k = Fine_probability_k
# Ta = Official_tax_Ta

updateData <- function(mwv, k, P1, P, Ta){
    
    # creates and(or) updates global data frame to provide data for the plot
    
    new_data <<- NULL
    new_data <<- as.data.frame(0:mwv)
    names(new_data) <<- 'V'
    new_data$IlD <<- k*P1/new_data$V
    new_data$IlD_fill <<- new_data$IlD
    new_data$IlD_fill[new_data$IlD_fill > Ta] <<- NA # we don't want ribbon to fill area above Official tax 
    new_data$IlL <<- Ta-k*P/new_data$V
    
    new_data$Ta <<- Ta
    new_data$zero <<- 0
    dta <<- melt(new_data, id.vars="V", measure.vars=c("IlD", "IlL", "Ta"))
    dta.lower <<- melt(new_data, id.vars="V", measure.vars=c("IlD_fill", "zero", "Ta"))
    dta.upper <<- melt(new_data, id.vars="V", measure.vars=c("Ta", "IlL", "Ta"))
    dta <<- cbind(dta, lower=dta.lower$value, upper=dta.upper$value)
    dta$name <<- factor(NA, levels=c("Illegal landfill owner's\nprofitable ratio",
                                    "Waste owner's\nprofitable ratio", 
                                    "Official tax"))
    dta$name[dta$variable=="IlD"] <<- "Illegal landfill owner's\nprofitable ratio"
    dta$name[dta$variable=="IlL"] <<- "Waste owner's\nprofitable ratio"
    dta$name[dta$variable=="Ta"] <<- "Official tax"
}

updateLabels <- function(k, P1, P, Ta){
    
    ### creates footnote caption for the plot
    
    prob <- paste('Fining probability = ', k, sep = '')
    landfilling_fine <- paste('Illegal landfilling fine = ', P1, sep = '')
    dumping_fine <- paste('Illegal dumping fine = ', P, sep = '')
    tax <- paste('Official tax = ', Ta, sep = '')
    note <<- paste(prob, landfilling_fine, sep = '; ')
    note <<- paste(note, dumping_fine, sep = '; ')
    note <<- paste(note, tax, sep = '; ')
    note
}


plotDumping <- function(mwv, P, P1, k, Ta){
    
    ### this function draws the plot
    
   # initialise plot data
    updateData(mwv, k, P1, P, Ta)
    updateLabels(k, P1, P, Ta)
    
    # draw the plot
    profit <- ggplot(dta, aes(x=dta$V, y=dta$value, ymin=dta$lower, ymax=dta$upper, 
                              color=dta$name, fill=dta$name, linetype=dta$name)) +
        geom_line(size=1.2) + 
        geom_ribbon(alpha=.25, linetype=0) +
        theme(axis.text.x = element_text(angle=0, hjust = 0),
              axis.title = element_text(face = 'bold', size = 14),
              title = element_text(face = 'bold', size = 16),
              legend.position = 'right',
              legend.title = element_blank(),
              legend.text = element_text(size = 12),
              legend.key.width = unit(2, 'cm'),
              legend.key.height = unit(1.2, 'cm'))+
        scale_linetype_manual(values=c(4, 5, 1)) +
        scale_fill_manual(values = c("#F8766D","#00BFC4",NA)) +
        scale_color_manual(values = c("#F8766D","#00BFC4", '#66CD00')) + 
        labs(title="Profitable ratio between the volume \nof illegally disposed waste \nand costs of illegal disposal of waste",
             x="Waste volume, cubic meters",
             y="Cost per cubic meter, RUB") +
        xlim(c(0, max(new_data$V)))+
        ylim(c(0, Ta*1.5))
        
    
    # add a footnote about paramaters used for the current plot
    profit <- arrangeGrob(profit, 
                          sub = textGrob(note, 
                                         x = 0, 
                                         hjust = -0.1, 
                                         vjust=0.1, 
                                         gp = gpar(fontface = "italic", fontsize = 12)))
    
    # show plot
    print(profit)

}


simDumping <- function(max_waste_volume = 2000, 
                       Illegal_dumping_fine_P = 300000,
                       Illigal_landfilling_fine_P1 = 500000,
                       Fine_probability_k = 0.5,
                       Official_tax_Ta = 600) {
    
    ### this function creates interactive plot
    
    max_waste_volume <<- max_waste_volume 
    Illegal_dumping_fine_P <<- Illegal_dumping_fine_P
    Illigal_landfilling_fine_P1 <<- Illigal_landfilling_fine_P1
    Fine_probability_k <<- Fine_probability_k
    Official_tax_Ta <<- Official_tax_Ta
    
    manipulate(suppressWarnings(plotDumping(max_waste_volume, 
                           Illegal_dumping_fine_P,
                           Illigal_landfilling_fine_P1,
                           Fining_probability_k,
                           Official_tax_Ta)
                           ),
               
               # set up sliders
               max_waste_volume = slider(0, 50000, 
                                         initial = max_waste_volume, 
                                         step = 100,
                                         label = 'X axis range'),
               Illegal_dumping_fine_P = slider(0, 5000000, 
                                               initial = Illegal_dumping_fine_P,
                                               step = 10000, 
                                               label = 'Illegal dumping fine (P)'),
               Illigal_landfilling_fine_P1 = slider(0, 5000000, 
                                                    initial = Illigal_landfilling_fine_P1, 
                                                    step = 10000,
                                                    label = 'Illegal landfilling fine (P1)'),
               Fining_probability_k = slider(0, 1, 
                                             initial = 0.5,
                                             step = 0.01,
                                             label = 'Probability of being fined (k)'),
               Official_tax_Ta = slider(0, 3000, 
                                        initial = Official_tax_Ta, 
                                        step = 50,
                                        label = 'Official waste disposal tax (T)')
    )
}

simDumping() # for reasons unknown I have to run this function twice to get proper interactive plot

Saturday, September 13, 2014

The Most Hilarious Rendering "Bug" I've Ever Seen

Can you guess the projection that I used to display a world map at the picture below (EPSG code is left there because I doubt someone would recall it anyway)?


It is the World Bonne projection in QGIS (original shp's CRS is EPSG:4326). I already had some fun with Bonne in this post. The world got torn apart at scale 1:75 000 000. At bigger scales map renders normally:


Fortunately this issue can be easily resolved by disabling "feature simplification by default for newly added layers" under Settings -> Options -> Rendering. 

Monday, September 8, 2014

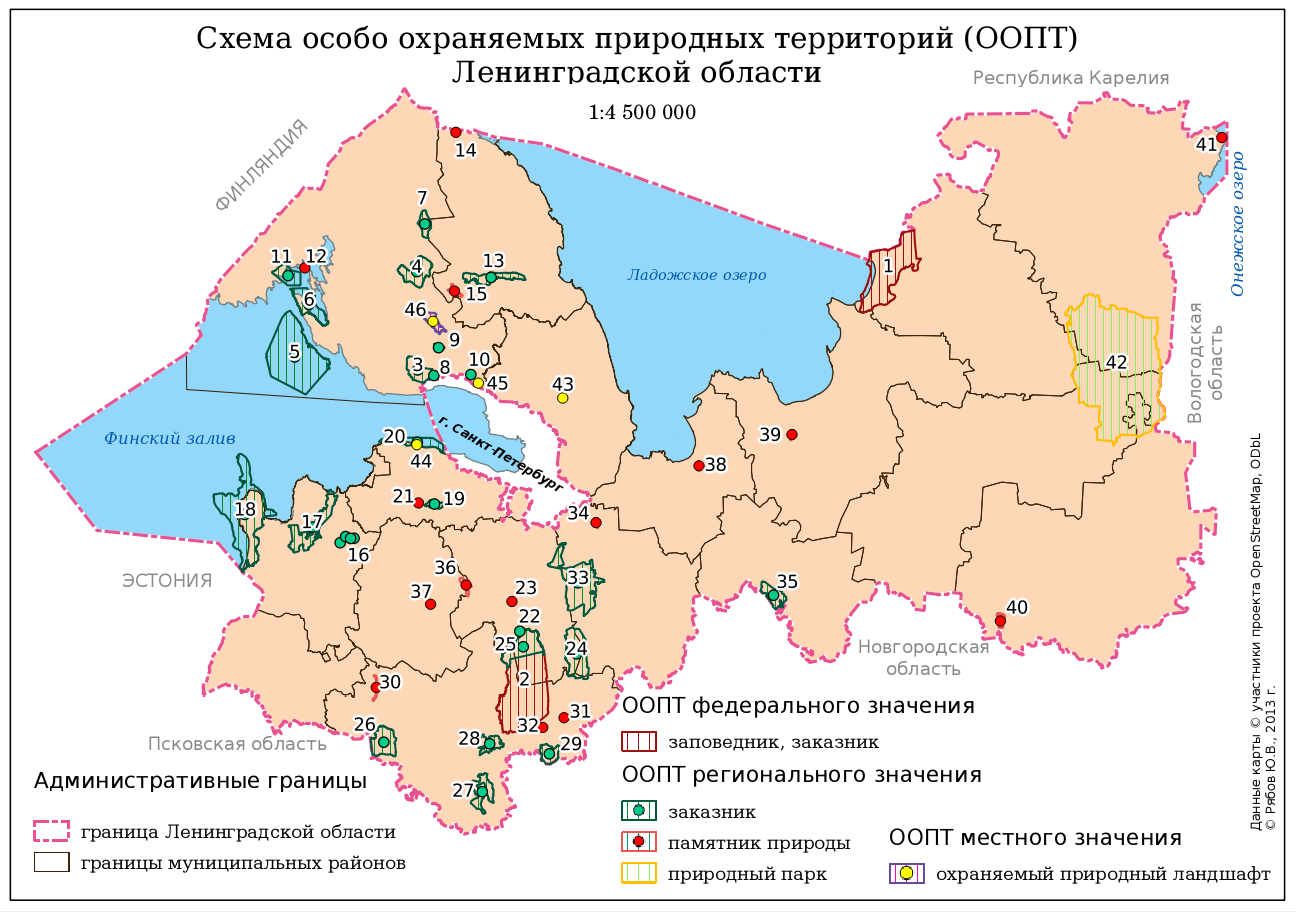
Schema of the Conservation Areas in Leningradskaya Region: Some Notes for Beginner Mappers

Schema of the Conservation Areas in Leningradskaya Region

About a year ago I was asked to create a small (a B5 size) and simple schema of the conservation areas in Leningradskaya region. I did it using QGIS. Here you are the author version of the schema and several notes that might be helpful for a beginner map-maker.

There was a huge disproportion between areas of different objects and both polygon and point markers were needed to show them. I decided to use Centroid Fill option in polygon style to be able to use only one layer (polygon) instead of two (polygon and point). Using Centroid Fill makes points in centres of the small polygons overlap and mask these tiny polygons. 

All the administrative borers were stored in one layer (and there are far more borders than one see here). They are drawn using rule-based symbology so I didn't even need to subset this layer to get rid of the rest of the polygons in this layer.

All the names of the surrounding countries, regions, city and the water bodies are not labels derived from layers, but labels created inside the map composer. It was quicker and their position was more precise which is crucial for such a small schema.

There was a lack of space for the legend so I had to utilise every bit of canvas to place it. I had to use 3 legend items here. One of them is actually overlapping the other and setting a transparent background for the legends was helping with that.

Finally labels for the conservation areas (numbers) were outlined with white colour to be perfectly readable. Some of them were moved manually (with storing coordinates in special columns of the layer) to prevent overlapping with other labels and data.

P.S. Don't be afraid to argue with the client about the workflow. Initially I was asked it manually digitise a 20 000 x 15 000 pixels raster map of the Leningrad region to extract the most precise borders of the conservation areas (and districts of the region). Of course I could do it and charge more money for the job, but what's the point if some of that borders are not even to be seen at this small schema? So I convinced client to use data from OSM and saved myself a lot of time.

Sunday, August 31, 2014

Donetsk Label at OpenStreetMap

Now, when Donetsk became the hot spot of the civil war at the Ukraine I decided to take a glance at the map of the war zone. Of course I used OSM for this. But despite I knew the approximate location of the city I couldn't find it for several minuets. I was confused... The reason was that "Donetsk" label (label of the city which is the administrative center of the Donetskaya region BTW) at the scales smaller than 10 km is suppressed by the label of adjusted town "Makeevka". WTF?! 

"Donetsk" ("Донецьк") label at OSM is suppressed by the label of adjusted town

Thursday, May 29, 2014

Random VS Pseudo Random PROC or Why Does Axe's Win Rate Dropped in 6.81 Patch (Dota 2)

Introduction

Here is an interesting post about 6.81 patch influence on heroes win rate in Dota 2. One point caught my attention: a drastic change in Axe win rate: from 52% to 48%; see image below.


Axe's win rate before and after 6.81 patch (29-th of April)
The only change Axe get in this patch was implementation of the preudo random approach for the determination of Counter Helix skill triggering instead of random. As was guessed in the article:  
"...where you manage to Berserker's Call several enemies, you only have 3.2 seconds of being unconditionally hit by the enemy. In this time frame, the amount of successful Counter Helixes that use PRD is probably lower than with a true random. Hence the decrease in damage output and Win Rate." 
 Ok, nice guess! Lets test it!

Create a simulation to test the hypothesis

Import needed modules
import random
import numpy
from tabulate import tabulate
import collections
Lets create functions to calculate number of Counter Helix PROCs for given number of hits using random and pseudo random approaches. First one will be using random approach (notice that random.randrange() actually generates pseudo random set of values)

def randHelixProc(hits):
  '''
  checks if Counter Helix PROCs (chance = 17%) using random approach
  @param hits: number of times Axe was hit
  @return procs: number of times Counter Helix PROCs
  '''
  procs = 0

  for i in xrange(hits):
    chance = random.randrange(1, 101)
    if chance < 18:
      procs += 1
    else:
      continue

  return procs

I don't know how exactly pseudo random PROCs are designed for Axe or for Dota 2 in general, but they say that the probability of the pseudo random event in Dota 2 in it initial state has lower chance to proc than the stated probability for the event and each time the event is not triggered when it could the chance for this event to occur is increased. Lets say some event triggers with the 50% chance. Suggested pseudo random approach can be realised with 3 consecutive checks that have different chances: 0%, 50% and 100% (average is 50%). When event finally triggers it reset chance for the event to initial value (0% in this case) and it all starts over again.
def pseudoRandHelixProc(hits):
  '''
  checks if Counter Helix PROCs (chance = 17%) using pseudo random approach
  @param hits: number of times Axe was hit
  @return procs: number of times Counter Helix PROCs
  '''
  treshold = 0
  prob_list = [2, 5, 9, 14, 23, 47] # ~17% on average
  procs = 0
  for i in xrange(hits):
    chance = random.randrange(1, 101)
    try:
      success = prob_list[treshold]
    except:
      success = prob_list[5]
    if chance >= success:
      treshold += 1
    else:
      procs += 1
      treshold = 0
  return procs
Check if the chances for PROCs are the same for the both functions. We should have 1700 procs of Counter Helix for 10000 attacs on Axe. Launch 100 simulations of 10000 hits for each function and compute average procs for random and pseudo random approaches.
rhelix_list = []
for i in xrange(100):
  value = randHelixProc(10000)
  rhelix_list.append(value)
numpy.mean(rhelix_list)

>>>1702.79

p_rhelix_list = []
for i in xrange(100):
  value = pseudoRandHelixProc(10000)
  p_rhelix_list.append(value)
numpy.mean(p_rhelix_list)

>>>1702.3
Output difference is negligible for random and pseudo random implementations.
Now its time to create a simulation function.
def simulation(times, hits):
  '''
  Computes average number of PROCs for given hits for random and pseudo random
  approaches and difference between them.

  @param times: number of times simulation will run
  @param hits: number of hits to simulate
  @return: average difference in pocs between random and pseudo random approaches;
           table of simul results
  '''
  # create lists of results
  diff_list = []
  rand_mean_list = []
  p_rand_mean_list = []

  # run simulation
  for hit in xrange(1, hits + 1):

    rand_list = []
    pseudo_rand_list = []

    for t in xrange(times):
      rand = randHelixProc(hit)
      p_rand = pseudoRandHelixProc(hit)
      rand_list.append(rand)
      pseudo_rand_list.append(p_rand)

    # compute statistics and populate lists of results
    rand_mean = numpy.mean(rand_list)
    rand_mean_list.append(rand_mean)
    p_rand_mean = numpy.mean(pseudo_rand_list)
    p_rand_mean_list.append(p_rand_mean)
    diff = rand_mean - p_rand_mean
    diff = round(diff, 2)
    diff_list.append(diff)

  # print average difference in PROCs
  total_diff = sum(diff_list)
  l = len(diff_list)
  print 'average difference:', total_diff/l
  print '#######################################################################################################'

  # create table output for simulation results
  out_dict = {}
  out_dict['(1) cumulative hits'] = range(1, l + 1)
  out_dict['(2) random mean PROCs'] = rand_mean_list
  out_dict['(3) pseudo random mean PROCs'] = p_rand_mean_list
  out_dict['(4) difference'] = diff_list
  out_dict = collections.OrderedDict(sorted(out_dict.items()))
  print tabulate(out_dict, headers = 'keys', tablefmt="orgtbl")
Lets run 100 simulations of 100 consecutive hits. Of course it is possible to run 10000 hits but it is unnecessary since every time the Counter Helix is triggered we jump back to the first row from the table below (result of the simulation). As was already mentioned:
"[if] ...you manage to Berserker's Call several enemies, you only have 3.2 seconds of being unconditionally hit by the enemy"
If Axe was able to catch 3 enemies, together they will hit him about 9-12 times. This means that with the pseudo random approach he will spin 0.3-0.4 times less than with random approach. It will cause him to deal ~(205*0.35)*3 = 215,25 (or 71.75 per hero) less damage in engagement.

So the hypothesis was true - pseudo random approach caused the decrease in damage output on the short time interval even if total number of PROCs during the game stayed the same.
average difference: 0.34
#######################################################################################################
|   (1) cumulative hits |   (2) random mean PROCs |   (3) pseudo random mean PROCs |   (4) difference |
|-----------------------+-------------------------+--------------------------------+------------------|
|                     1 |                    0.17 |                           0    |             0.17 |
|                     2 |                    0.45 |                           0.09 |             0.36 |
|                     3 |                    0.56 |                           0.12 |             0.44 |
|                     4 |                    0.71 |                           0.26 |             0.45 |
|                     5 |                    0.81 |                           0.36 |             0.45 |
|                     6 |                    1.06 |                           0.75 |             0.31 |
|                     7 |                    1.37 |                           0.88 |             0.49 |
|                     8 |                    1.35 |                           0.97 |             0.38 |
|                     9 |                    1.47 |                           1.22 |             0.25 |
|                    10 |                    1.64 |                           1.33 |             0.31 |
|                    11 |                    1.95 |                           1.65 |             0.3  |
|                    12 |                    2.1  |                           1.68 |             0.42 |
|                    13 |                    2.36 |                           1.79 |             0.57 |
|                    14 |                    2.56 |                           2.16 |             0.4  |
|                    15 |                    2.61 |                           2.26 |             0.35 |
|                    16 |                    2.61 |                           2.37 |             0.24 |
|                    17 |                    2.87 |                           2.43 |             0.44 |
|                    18 |                    2.77 |                           2.83 |            -0.06 |
|                    19 |                    3.22 |                           2.84 |             0.38 |
|                    20 |                    3.03 |                           2.84 |             0.19 |
|                    21 |                    3.6  |                           3.22 |             0.38 |
|                    22 |                    3.71 |                           3.32 |             0.39 |
|                    23 |                    3.68 |                           3.68 |             0    |
|                    24 |                    3.93 |                           3.72 |             0.21 |
|                    25 |                    4.54 |                           3.92 |             0.62 |
|                    26 |                    4.65 |                           4.04 |             0.61 |
|                    27 |                    4.47 |                           4.27 |             0.2  |
|                    28 |                    4.83 |                           4.39 |             0.44 |
|                    29 |                    4.78 |                           4.48 |             0.3  |
|                    30 |                    4.93 |                           4.8  |             0.13 |
|                    31 |                    5.3  |                           4.92 |             0.38 |
|                    32 |                    5.1  |                           5.04 |             0.06 |
|                    33 |                    5.79 |                           5.34 |             0.45 |
|                    34 |                    5.82 |                           5.54 |             0.28 |
|                    35 |                    6.04 |                           5.52 |             0.52 |
|                    36 |                    5.67 |                           5.7  |            -0.03 |
|                    37 |                    6.64 |                           5.98 |             0.66 |
|                    38 |                    6.4  |                           6.03 |             0.37 |
|                    39 |                    6.72 |                           6.41 |             0.31 |
|                    40 |                    7.07 |                           6.46 |             0.61 |
|                    41 |                    7.04 |                           6.59 |             0.45 |
|                    42 |                    7.18 |                           6.81 |             0.37 |
|                    43 |                    7.08 |                           6.9  |             0.18 |
|                    44 |                    7.61 |                           7.09 |             0.52 |
|                    45 |                    7.72 |                           7.21 |             0.51 |
|                    46 |                    7.73 |                           7.66 |             0.07 |
|                    47 |                    8    |                           7.68 |             0.32 |
|                    48 |                    8.41 |                           7.7  |             0.71 |
|                    49 |                    8.57 |                           7.93 |             0.64 |
|                    50 |                    8.54 |                           8.11 |             0.43 |
|                    51 |                    8.16 |                           8.31 |            -0.15 |
|                    52 |                    9    |                           8.4  |             0.6  |
|                    53 |                    9.01 |                           8.79 |             0.22 |
|                    54 |                    8.98 |                           8.88 |             0.1  |
|                    55 |                    9.54 |                           8.99 |             0.55 |
|                    56 |                    9.4  |                           9.13 |             0.27 |
|                    57 |                    9.75 |                           9.08 |             0.67 |
|                    58 |                   10.1  |                           9.42 |             0.68 |
|                    59 |                    9.71 |                           9.64 |             0.07 |
|                    60 |                   10.31 |                           9.87 |             0.44 |
|                    61 |                   10.19 |                          10.31 |            -0.12 |
|                    62 |                   10.29 |                          10.21 |             0.08 |
|                    63 |                   10.76 |                          10.55 |             0.21 |
|                    64 |                   10.82 |                          10.48 |             0.34 |
|                    65 |                   10.7  |                          10.77 |            -0.07 |
|                    66 |                   11.27 |                          10.94 |             0.33 |
|                    67 |                   11.81 |                          11.06 |             0.75 |
|                    68 |                   11.54 |                          11.34 |             0.2  |
|                    69 |                   11.98 |                          11.26 |             0.72 |
|                    70 |                   12.26 |                          11.66 |             0.6  |
|                    71 |                   11.35 |                          12.01 |            -0.66 |
|                    72 |                   12.03 |                          11.64 |             0.39 |
|                    73 |                   12.37 |                          11.94 |             0.43 |
|                    74 |                   12.74 |                          12.16 |             0.58 |
|                    75 |                   13.16 |                          12.66 |             0.5  |
|                    76 |                   12.77 |                          12.59 |             0.18 |
|                    77 |                   13.1  |                          12.65 |             0.45 |
|                    78 |                   13.2  |                          12.95 |             0.25 |
|                    79 |                   13.59 |                          13.06 |             0.53 |
|                    80 |                   13.32 |                          13.27 |             0.05 |
|                    81 |                   13.74 |                          13.25 |             0.49 |
|                    82 |                   13.98 |                          13.47 |             0.51 |
|                    83 |                   14.86 |                          13.74 |             1.12 |
|                    84 |                   14.53 |                          13.8  |             0.73 |
|                    85 |                   14.54 |                          14.29 |             0.25 |
|                    86 |                   14.49 |                          14.22 |             0.27 |
|                    87 |                   15.03 |                          14.46 |             0.57 |
|                    88 |                   15.49 |                          14.55 |             0.94 |
|                    89 |                   15.51 |                          14.8  |             0.71 |
|                    90 |                   15.58 |                          15    |             0.58 |
|                    91 |                   16.17 |                          15.01 |             1.16 |
|                    92 |                   14.89 |                          15.43 |            -0.54 |
|                    93 |                   15.73 |                          15.4  |             0.33 |
|                    94 |                   16.16 |                          15.67 |             0.49 |
|                    95 |                   16.11 |                          16.17 |            -0.06 |
|                    96 |                   16.03 |                          16.17 |            -0.14 |
|                    97 |                   16.41 |                          16.07 |             0.34 |
|                    98 |                   17.26 |                          16.27 |             0.99 |
|                    99 |                   15.65 |                          16.7  |            -1.05 |
|                   100 |                   16.15 |                          16.96 |            -0.81 |

Thursday, May 8, 2014

Classification of the Hyper-Spectral and LiDAR Imagery using R (mostly). Part 3: Shadow Removal

This is my third post in this series, here are the links to the Part 1 and Part 2. Sorry for the delay, but at that time I got completely consumed with my PhD thesis and this story just went out of my mind.

To the point. There were 2 types of shadows I had to deal with: cloud shadows and cast shadows (from building and trees). In scientific literature you can find several relatively complicated algorithms to deal with them (including DEM usage for cast shadow detection) and I definitely should have used some of them, but... I was too lazy to implement them when there were couple of quick'n'dirty workarounds available.

Cloud shadow removal

To remove cloud shadows I decided to calculate ratio between mean pixel value of the lighted up and shadowed parts of the raster for each band and multiply shadowed pixels by this ratio.  I manually created a mask for shadowed areas. There were 3 areas and their borders were quite distinct in NIR channels:

Cloud shadows in one of the NIR bands

I drew several polygons over shadows in QGIS and converted them to raster (Raster -> Conversion -> Rasterise). Now everything was ready for patching:

library(raster)
library(rgdal)

# load rasters
image <- stack('2013_IEEE_GRSS_DF_Contest_CASI.tif') # hyper spectral imagery
s_mask <- raster('shadow_mask.tif') # mask for cloud shadow

# extract shadowed area
m_cloud <- s_mask
m_cloud[m_cloud < 1] <- NA
shadowed <- mask(image, m_cloud)

# calculate zonal statistics
zd <- zonal(image, s_mask, fun = 'mean', na.rm = T)
zd <- as.data.frame(zd)

# calculate ratio between lighted up and shadowed zones
zd[3,] <- zd[1,] / zd[2,] 

# recalculae data in shadows
multiplyer <- zd[3,]
multiplyer <- multiplyer[,2:ncol(zd)]
multiplyer <- as.numeric(multiplyer)
enlight <- shadowed*multiplyer # patch layer
restored <- cover(enlight, image, progress = 'text')

# save result
wr <- writeRaster(restored, 
                  filename = 'restored.tif', 
                  datatype = 'GTiff', overwrite = TRUE)


Now it's time to check out results:

The same NIR band after cloud shadow removal
Yes, we can easily find patched areas, but overall result is good for such simple approach.

Cast shadow removal

Shadows from buildings can be processed the same way as cloud shadows as shown above except mask creation approach is different. In case of cast shadows they have to be detected automatically (for there are a bit more than 3 as in case with clouds). Using one of the NIR bands I created a learning sample of points and passed it to Random Forest algorithm to classify imagery into shadowed and non-shadowed areas. I will not describe here this classification process for Random Forest was used for overall classification of the imagery and it is the subject of my next post of this series.

Monday, April 21, 2014

Unify Extent and Resolution Script Updated

Script for unifying extent and resolution is now able to work with multi-band rasters. Also I fixed an error that caused output rasters to have different resolutions in some cases.

Sunday, March 16, 2014

Analysis of the Time Aspect of the Matches at The International 3 (Dota 2 Tournament)

It's been a while since I analysed something with R. I decided to pick into Dota 2 statistics. This game is the real eSport now with players fighting for respectable prise pools. And the main Dota 2 event is The International where best teams compete each other in astonishing battles.

So I grabbed some stats on The International 3 from here and started to think what can I do with it... The one major aspect of the game that was actively discussed prior the Tournament was the Dire side has an advantage over the Radiant via having Roshan Pit in their possession. Many people still think that Dire side is preferable in competitive games (they say that Roshan is killed by the Dire in 70% of cases). In fact The Alliance (TI3 winner) played like 90% of their games on the Dire side at the tournament. But is it a valid proof of the Dire side advantage? - I doubt. I think that in contrary - the Radiant side has an advantage over Dire, but I will add my arguments after I prove I'm right.

Ok, here is my hypothesis. There is no time limitation for the game. The match in Dota 2 lasts until the main building of the one of the sides is destroyed (or one of the team will give up). So if one of the sides (all the other things being equal) has an advantage it will cause the median time that was used to win the game for this side to be lower than to win for the other (and vice versa for time to loose). So lets take a look at the boxplot below:

dota 2 the international 3 winning time comparrison by side
Dire Vs Radiant winning time comparisson

Code:
library(ggplot2)

TI3 <- read.csv("~/R/Dota2_Stats/The_International-3")

# create winning time per side plot
p <- ggplot(TI3, aes(TI3[,5], TI3[,8])) +
  geom_boxplot(aes(fill = TI3[,5]))+
  labs(title = 'Winning time per side at TI-3',
       x = 'Side',
       y = 'Time, min.',
       fill = 'Side')
  
print(p)
Clearly, the Radiant side generally wins slightly quickly then Dire (and have higher number of wins: 82 against 76). This means that not the Dire, but the Radiant team has an advantage in game. But why? (You may skip the rest of the paragraph if you never played Dota). There are several reasons. Radiant advantages are: easier rune control, ability to deny creeps at the hard lane, camera angle (it is not parallel to the terrain surface and facing north towards the Dire side). Camera angle was never discussed as the advantage/disadvantage because most people just got used to it, but Radiant has slight, but sure vision advantage. Seems Roshan accessibility and a safer ancient camp does not help that much to the Dire. 

What else can we do with time analysis? We can compare win and loss times for all the teams that competed at TI3:
Teams winning and loosing time comparison
Code:
# get the list of teams
Teams <- unique(TI3[,3])

# create dataset to store data about winning/loosing times
A_time <- data.frame('Team'= character(),
                     'Result' = character(),
                     'Time' = numeric(),
                     stringsAsFactors = FALSE)

# extract time data and write it to the A_time data frame
for (team in Teams) {
  A <- subset(TI3, TI3[,3] == team | TI3[,4] == team)
    
  for (i in 1:nrow(A)) {
    winner <- A[i,][5]
    dire <- A[i,][4]
    radiant <- A[i,][3]
    time <- A[i,][8]
    if ( (winner == 'DIRE' & dire == team) | (winner == 'RADIANT' & radiant == team) ) {
     result <- paste(team, 'WIN')
    }
    else {
     result <- paste(team, 'LOSS') 
    }
    A_time[(nrow(A_time)+1),] <- c(team,result, time)
  }
}

# create plot for winning time per team
p <- ggplot(A_time, aes(A_time[,2], A_time[,3])) +
     geom_boxplot(aes(fill = A_time[,1]))+
     theme(axis.text.x = element_text(angle=90, hjust = 0),
          axis.title = element_text(face = 'bold', size = 14),
          title = element_text(face = 'bold', size = 16),
          legend.position = 'right'
          ) +
     labs(title = 'Win and loss times at The International 3',
          x = 'Results',
          y = 'Time, min.',
          fill = 'Teams')
  
print(p)

Generally my assumption was correct: better teams wins quicker. Alliance and NaVi  (1-st and 2-nd places) is a nice conformation to it (DK and IG (TI-2 champion) have the similar pattern as well despite shared 5-th place). But Orange and TongFu (3-rd and 4-th place) tends to loose quicker than win. This could be explained by the general playstile of this two Asian teams which often aims at the late game. This infamous style with prolonged no action farming stage is often referred as 'Chinese Dota'. But DK and IG are Chinese teams too.   Seems that both TongFu and Orange were able overcame the odds and jumped over their heads in the given tournament. They took places that DK and IG should have get (DK and IG were more favourable teams than Orange and TongFu before the tournament).

Monday, February 3, 2014

About Corruption and Economical Health of Countries

There is a quite interesting article about the corruption level in EU countries was published at BBC recentely. Of course the map is the most interesting part. 


The thing that I totally noticed in the very first moment of observing it, is that the countries with the highest corruption level have the lowest credit ratings (see this interactive map).


When will all these bastards understand that corruption hurts everyone?

Saturday, January 4, 2014

Unifying Extent and Resolution of Rasters Using Processing Framework in QGIS

My post about modification of extent and resolution of rasters drew quite a bit of attention and I decided to make a small New Year's present to the community and create a QGIS Processing script to automate the process.

The script was designed to be used within Processing module of QGIS. This script will make two or more rasters of your choice to have the same spatial extent and pixel resolution so you will be able to use them simultaneously in raster calculator. No interpolation will be made - new pixels will get predefined value. Here is a simple illustration of what it does:
Modifications to rasters A and B


To use my humble gift simply download this archive and unpack files from 'scripts' folder to your .../.qgis2/processing/scripts folder (or whatever folder you configured in Processing settings). At the next start of QGIS you will find a 'Unify extent and resolution' script in 'Processing Toolbox' in 'Scripts' under 'Raster processing' category:

If you launch it you will see this dialogue:
Main window


Note that 'Help' is available:
Help tab
Lets describe parameters. 'rastersare rasters that you want to unify. They must have the same CRS. Note that both output rasters will have the same pixel resolution as the first raster in the input.
Raster selection window
'replace No Data values with' will provide value to pixels that will be added to rasters and replace original No Data values with the value provided here. Note that in output rasters this value will not be saved as No Data value, but as a regular one. This is done to ease feature calculations that would include both of this rasters, but I'm open to suggestions and if you think that No Data attribute should be assigned I can add corresponding functionality.

Finally you mast provide a path to the folder where the output rasters will be stored in 'output directory' field. A '_unified' postfix will be added to the derived rasters file names: 'raster_1.tif' -> 'raster_1_unified.tif'

If CRSs of rasters won't match each other (and you will bypass built-in check) or  an invalid pass will be provided a warning message will pop up and the execution will be cancelled:
Example of the warning message
When the execution is finished you will be notified and asked if rasters should be added to TOC:


Happy New Year!

P.S. I would like to thank Australian government for making the code they create an open source. Their kindness saved me a couple of hours.