What I love about QGIS is that one is able to create a nice map quickly. The other day I was asked to make a situation map for the project we are working on to include it into presentation. Аll I had was a laptop with no relevant spatial data at all, but with QGIS installed (I even had no mouse to draw something). Though it was more than enough: I loaded OSM as a base layer and used annotation tool to add more sense to it. Voilà:
What is the cause for the degradation of environment?
Capitalism, corruption, consuming society? - OVERPOPULATION!
Please, save the Planet - kill yourself...
Showing posts with label OSM. Show all posts
Thursday, June 18, 2015
Monday, September 8, 2014
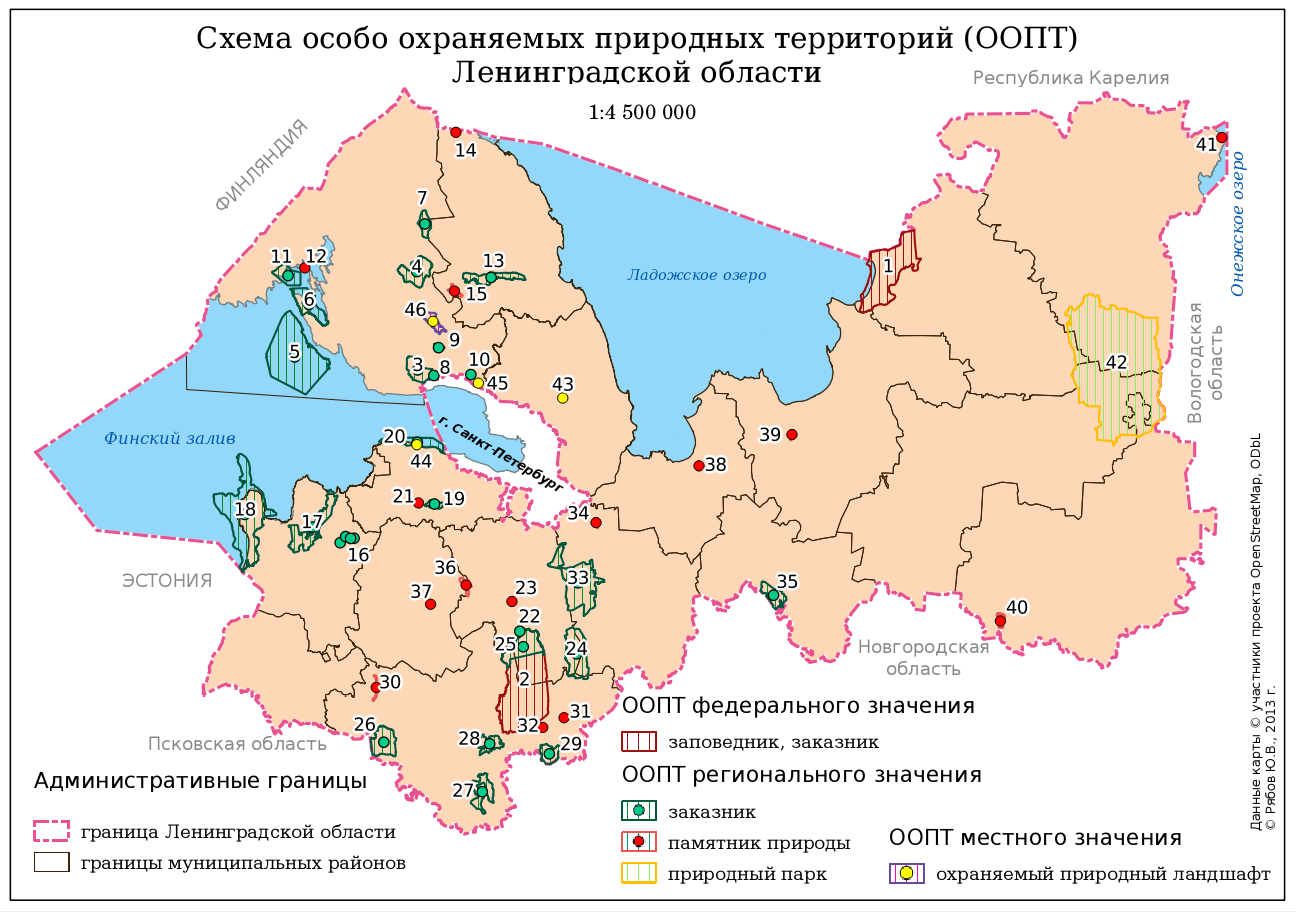
Schema of the Conservation Areas in Leningradskaya Region: Some Notes for Beginner Mappers
![]() |
| Schema of the Conservation Areas in Leningradskaya Region |
About a year ago I was asked to create a small (a B5 size) and simple schema of the conservation areas in Leningradskaya region. I did it using QGIS. Here you are the author version of the schema and several notes that might be helpful for a beginner map-maker.
There was a huge disproportion between areas of different objects and both polygon and point markers were needed to show them. I decided to use Centroid Fill option in polygon style to be able to use only one layer (polygon) instead of two (polygon and point). Using Centroid Fill makes points in centres of the small polygons overlap and mask these tiny polygons.
All the administrative borers were stored in one layer (and there are far more borders than one see here). They are drawn using rule-based symbology so I didn't even need to subset this layer to get rid of the rest of the polygons in this layer.
All the names of the surrounding countries, regions, city and the water bodies are not labels derived from layers, but labels created inside the map composer. It was quicker and their position was more precise which is crucial for such a small schema.
There was a lack of space for the legend so I had to utilise every bit of canvas to place it. I had to use 3 legend items here. One of them is actually overlapping the other and setting a transparent background for the legends was helping with that.
Finally labels for the conservation areas (numbers) were outlined with white colour to be perfectly readable. Some of them were moved manually (with storing coordinates in special columns of the layer) to prevent overlapping with other labels and data.
P.S. Don't be afraid to argue with the client about the workflow. Initially I was asked it manually digitise a 20 000 x 15 000 pixels raster map of the Leningrad region to extract the most precise borders of the conservation areas (and districts of the region). Of course I could do it and charge more money for the job, but what's the point if some of that borders are not even to be seen at this small schema? So I convinced client to use data from OSM and saved myself a lot of time.
Labels:
environment
,
GIS
,
Leningrad region
,
maps
,
OSM
,
QGIS
,
spatial data
Sunday, August 31, 2014
Donetsk Label at OpenStreetMap
Now, when Donetsk became the hot spot of the civil war at the Ukraine I decided to take a glance at the map of the war zone. Of course I used OSM for this. But despite I knew the approximate location of the city I couldn't find it for several minuets. I was confused... The reason was that "Donetsk" label (label of the city which is the administrative center of the Donetskaya region BTW) at the scales smaller than 10 km is suppressed by the label of adjusted town "Makeevka". WTF?!
![]() |
| "Donetsk" ("Донецьк") label at OSM is suppressed by the label of adjusted town |
Labels:
OSM
Wednesday, June 27, 2012
Conference Announcement: Open GIS!
Open GIS! is a conference for users and developers of open-source GIS. It will take place on November 17-18, 2012 in Moscow, Russia. The really cool thing is that participation in this crowd-source conference is free of charge!!! Of course modest donations will be appreciated and a sponsorship as well, but it is not mandatory - we want this event to be available for everyone who are interested in open geospatial software and data. Download leaflet!
A call for papers will be opened in August but already now you may propose topics of your talk or master-class to the committee.
Please, spread the word!
P.S. If you are (a rear) person who interested in illegal dumping research (from geospatial point of view) - come to this conference to hear my talk on it!
Labels:
education
,
GIS-Lab
,
illegal dumps and landfills
,
Moscow
,
OSM
,
science
,
spatial data
Wednesday, November 30, 2011
Relation Between Fires and Distanse to the Nearest Road (Recalculated)
As you may already know, I'm a proud owner of AMD FX-8150 8-core CPU. And I've purchased it not for gaming reasons, but for science. My previous CPU was painfully slow with such calculations as determination of the relation between fires and distance to the nearest highway. I even didn't try to perform that calculations on the whole dataset of the roads mapped in OSM in Leningrad region. But now I can do this!
With the new CPU I've recalculated previous distribution (with the same data) in dependence only on highways and performed new calculation on the whole roads dataset. Some numbers first:
- 6,990 - number of fire points detected by FIRMS for the last 10 years in Leningrad region;
- 10,966 - number of the highway features used as highways for calculations;
- 87,422 -number of features from whole dataset of roads;
- 2,3 Gb RAM and a single core were consumed by R during calculations for the whole dataset.
![]() |
| Recalculated fire distribution for the highways |
Recalculated values for the highways are different to the acquired at the last time despite the data was the same. But there were hardware update and most important - software updates for R and its packages (OS was updated too). But this graph looks far more reasonable than the previous one.
Lets see what we've got for the whole roads dataset (I will compare it to the graph above).
![]() |
| Distribution calculated for the whole dataset of roads |
The maximum distance from road decreased almost in to times: from 41 to 26 kilometres. The distance for the highest values decreased accordingly: a rapid decreasing stops at 7 kilometres and for only highways it was 18 kilometres.
So the first 5 kilometres from the road are the most probable zone fore the fire event. This distance is easily covered on foot in two hours. Another evidence of the massive anthropogenic impact on fire starting.
If I will ever lay hands on the road data from the topographic maps (here OSM data used) I will perform the calculation again to get the most precise data.
Conclusion: FX-8150 worth buying )))
Labels:
disaster
,
Leningrad region
,
OSM
,
R
,
Russia
,
science
,
spatial data
,
St. Petersburg
Friday, August 19, 2011
Relation Between Fires and Distanse to the Nearest Highway
Instead of introduction
Just for fun I decided to investigate relationship between fires intensity in Leningrad region (and St. Petersburg as well) and distance to the nearest road in order to gain the evidence of the major influence of the anthropogenic factor on fire starting.
Materials and methods
Data used:
- FIRMS fire data;
- OSM data from GIS-LAB.info.
OSM data about major roads of Leningrad region was used to create a distance map. Distance map and data about locations of the fires detected from 2001 to June 2011 were used as arguments for the R "rhohat" function of "spatstat" package in order to investigate dependence of fires intensity on distance to the nearest highway.
Results and discussion
Firstly lets look at the map of the fires intensity distribution in space below (this map is rough and was created just to demonstrate the situation in general and it wasn't used for the computations described below). Due to usage of the roads at this map will be a hinder for fire data I used railways instead.
![]() |
| Rough fires intensity distribution in Leningrad region |
As you can see, fires intensity is [somewhat] related to the location of the railways: note that there are almost no fires at the east side of the map where railways net is sparse (north side of the map is similar, but there is Ladoga Lake located). Ofcourse railways are not the cause for the fires by themselves, but I suppose that in this particular case this can be evidence of the significant human influence on the fire events.
I believe you think that if we want to find clear evidence of the human influence on starting fire than we should investigate density of the population and compare it to the fires intensity. Fair enough, but you may do it by yourself using official data if you want. I will not do it because the results will be flawed. There is an issue with population - there is no data for the actual population of Leningrad region in summer (late spring and early autumn as well) time - the time of fires. At this time a lot of people from St.Petersburg go to their summer houses in Leningrad region (take into account that the population of St. Petersburg is 5 times higher than a population of Leningrad region) and you have to estimate population of the region accordingly, and it is far not a trivial task.
So we have to investigate not the population density by itself, but the proximity of the areas that were on fire to the population. We will measure the proximity as a distance to the nearest highway. Ofcourse it is better to use all available roads for such research, but if we will do so, R will calculate it for a very long time (there are over 80 000 features in the shp-file) - I've stopped the process after 10 hours of waiting. So I've used only major highways (with "primary", "secondary", "trunk", "tertiary" and "motorway" attributes in OSM) - over 10 000 features.
rhohat{spatstat} function was used to create the following graph:
![]() |
| Dependence of the fires distribution on the distance to the nearest highway |
There is an interesting "sinusoid" from 18th to 38th kilometre. Narrow gray stripe demonstrates possible error so I assume that this graph is reliable. I need to explain it somehow. My wife who is better mathematician than I tells that the best explanation is a shitty computation. Well, it is possible. But I have another opinion.
Possible explanations:
- Remember that we left more than 70 000 roads outside our calculations for this graph and there are a lot of roads which are not recorded in OSM. I suppose that if we would use almost complete dataset of roads in Leningrad region and more powerful computer than mine we would have more adequate graph where this sinusoid may disappear.
- Proximity, estimated here is not only a proximity for "occasional fire starters" but also a proximity for fire fighters. If a fire starts far away from the road it is more difficult to fight it. So this is about fire data and how we treat it for the computation: it is possible that fire events are continuously less frequent as we move away from the highway, but single event produce fire which covers larger area than average due to it is hard to fight it quickly, and this single event produce more "hotspots" (which were used for this mini-research) than average event.
Conclusions
We have got a strong evidence that anthropogenic factor plays a major role as cause for fire in Leningrad region: intensity of fires riches its maximum at distance of 2-3 km away from the road and then goes down.
"Sinusoid" between 18th and 38th kilometres may be caused by insufficiency of the road data used. Calculations should be repeated with more comprehensive data. Also it may be necessary to pre-process fire data in order to replace "hotspots" related to a single fire event with the single point i.e. to make it one point for one fire.
UPD: the story continues here.
Labels:
GIS
,
GIS-Lab
,
Leningrad region
,
OSM
,
R
,
science
,
spatial data
,
St. Petersburg
Sunday, June 19, 2011
3 cool events of the week
There were 3 very interesting events on this week (during my official vacation):
- a Russian - Finnish workshop dedicated to our project related to management of hazardous part of household waste.
- An "International" conference named "An Environmental Equilibrium"; and...
- OSM mapping party in Volhov town.
A workshop passed as always: Russians posed themselves as know-all persons (despite no one was prepared because all the materials were in English...), talked a lot but ineffective; and Finnish did the real job. For the first time in my life I had to be a parallel Russian-Finnish and a Finnish-Russian translator. A hard job, I have to admit...
"An Environmental Equilibrium" conference (which first day I missed because of the workshop) exceeded my expectations... a little, actually, but nevertheless. The funniest thing was that the first face I saw when entered the lecture hall was the face of my scientific adviser, who new that I will participate but didn't tell me that he will be a participant too O_o. He leaved quickly so we were unable to talk.
There were not as many people as expected (because of the summer time and a poor feedback from organisers, who didn't provided participants with the time table in advance, I suppose the main part of scientists who sanded papers preferred to be somewhere else) - organisers even had to merge together all the sections because of the lack of speakers. The good thing was that the publications were ready and I was able to enjoy my article on the subject of illegal dumping monitoring at St. Petersburg with implementation of high-resolution satellite imagery. The bad thing was that my scientific adviser had already left the conference when I demonstrated my presentation.
An unexpected finding was that the map in my Garmin, which expected to be fresh, had a poor an outdated information about location of the conference and OSM was also poor, but up to date.
OSM mapping party in Volhov was my first mapping party. Despite there were few participants (actually if there were more of them I wouldn't be able to participate at all because in that case party would took place a week earlier, when I was on vacation in Narva... and mapped it; collected data became more important due to imagery for Narva won't be available soon) and heavy rain (from time to time) we were able to survey western part of town.
After 2 hours of mapping we gathered at the cafe to discuss our survey. I've made an attempt to find an answer for the the question about mapping managed green areas, but it seems that I'm the only one who care.
The most unpleasant part was an attention from drunken ex-prisoner in cafe, who started to ask questions about our activities and then begged for money for beer. In Narva my wife and I brought attention of the local drunkards while survey too...
In the end we had a nice attraction on board of Zverik's jeep - a survey of the Russian roads ;-)
The most unpleasant part was an attention from drunken ex-prisoner in cafe, who started to ask questions about our activities and then begged for money for beer. In Narva my wife and I brought attention of the local drunkards while survey too...
In the end we had a nice attraction on board of Zverik's jeep - a survey of the Russian roads ;-)
Labels:
environment
,
illegal dumps and landfills
,
Leningrad region
,
OSM
,
science
Saturday, June 11, 2011
OSM, GIS-LAB.info and QGIS for EDUCATION
![]() |
| Current situation map (click to enlarge) |
I decided to acquire a diploma of The Baltic University in Sustainable Town Planning (master course). We had a practical task to study a district of St. Petersburg of our choice. Spatial planning is inconceivable without maps. But for every map you need a source and if the information in this source is incomplete you have to add it yourself.
![]() |
| A noise pollution map (click to enlarge) |
The plan was borne quickly. I already had a GPS (because if you are a geographer it isn't cool not to have one); I was aware of the OpenStreetMap existence and already used its data provided by GIS-LAB.info as a complete project for QGIS. All I needed is to take look at the district at OSM, add needed information to OSM and simply download ready to use base map from GIS-LAB.info.
Of course it wasn't that simple (there were tagging issues in OSM, missing objects in ready to use projects, and the project had to be significantly customised), but in the end chosen district became one of the most detailed in St. Petersburg and I was able to create cool maps ;-)
As a conclusion I would suggest for the spatial planning lecturers to use this practice of OSM utilisation through contribution for the student's practical tasks: they will improve their GPS skills, their work will be useful for other people (OSM will became more comlete), also students will learn something about Creative Commons licenses and will learn how to attribute their maps properly.
![]() |
| Map for development (click to enlarge) |
Labels:
education
,
GIS
,
GIS-Lab
,
OSM
,
science
,
spatial data
,
St. Petersburg
Subscribe to:
Posts
(
Atom
)