What is the cause for the degradation of environment?
Capitalism, corruption, consuming society? - OVERPOPULATION!
Please, save the Planet - kill yourself...

Friday, February 17, 2012

About Environmental Risk Assessment

There was a scientific seminar dedicated to environmental risks assessment in the scientific-research centre where I work. A speaker was awfully ignorant in subject unfortunately. As a person who is experienced in environmental risk assessment (see my posts about risks and a particular methodology) I was afraid that I will be the one to ask the speaker (quite an old man) some inconvenient question about formulas he used, but luckily he was ashamed by someone else.

During the discussion the question of monetary aspect of the risk and damage to environment was raised: whether it is possible to use money as the measure of risks that only applicable to environment itself. In other words: is it rational to use money when assessing possible damage to solely ecosystem (there are no money in ecosystem by itself), and how to perform such assessment?

What do YOU think? I wasn't able to find an appropriate answer at that moment, but now I believe I have a point. My answer is YES, we can use money to assess risks and damage dealt to ecosystem only.

Firstly the assessment is made by humans and for humans. And humans understand monetised value more easily. The approach that I want to propose is about assessment of money that have to be spent to recover ecosystem to exact the same state it was prior to caused or possible damage. Just imagine how much money one have to spent for recreating and reintroduction of just one extinguished species (a tasmanian wolf for example). Here you are a monetised damage to environment.

Another approach I have in mind is about evaluation of risks via relative live value of species (which can be easily monetised too). Lets use this formula for evaluation of life of individual of a given species: V=(1/N)*P, where V - relative value, N - population of the given species (or given areal of species), P - total population of the human beings. We will have a relative value as 1 for humans and 1*(P/N) for a given species. For example for a tiger we will have its relative individual value about 1 076 900! Literally, if we have a choice whether to save 1 million people or a single tiger, the tiger must be saved - not a million of people!!!

And we can monetise this value by multiplication on the average value of the single human life (you can play a bit with numbers given here).

So the damage to ecosystem may be assessed via loss of number of individuals of species that live in a given ecosystem and we are able to easily evaluate a relative value of the individuals of the each species, and it can be easyly monetised.

Wednesday, February 15, 2012

Legal and Illegal Dumps in Voronezhskaya Region, Russia

I couldn't believe my eyes when I saw that map! The true situation with waste management uncovered at the official geoportal of Voronezhskaya region.

The geoportal itself is quite good especially for Russia and thare are a lot of information. It is even possible to download some of the data and almost all metadata. And because of their kindness we can see the ugly face of true Russian environmental ignorance and corruption:

Dumps in Voronezhskaya region: Red circles - illegal dumps; Green circles - officially allowed, unlicensed dumps; Squares with circles inside - landfills
First of all - you may see how many red circles out there. These are my "favourite" illegal dumps... terrible indeed. 

But look at all these green circles and don't let them trick you: green here does not stand for "green". These are the same as illegal dumps, but... legal! Yes, these are dumps and their owners have no license for waste treatment and will never have because the soil and ground waters are not protected there.

So we have 9 landfills there. But not all of them have licence too... And finally there are no waste treatment plant at all.

Here you are an ugly inconvenient truth about dumps in Russia. Thanks to administration for shearing with us, but too bad they paint the same shit in different colours.

Monday, February 6, 2012

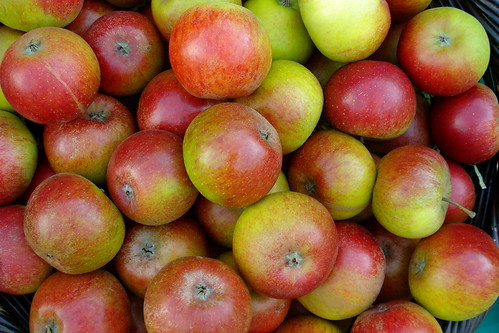
2011 - An Apple Year

(Photo by net_efekt - CC-BY)

Just for the record, 2011 was remarkably plentiful of apples in European part of Russia. So I ate a lot of apple jam this winter and even tasted a home made apple wine.

Maybe there will be another apple year in future and it will be possible at least to try to estimate an interval for this phenomenon.

Wednesday, January 18, 2012

Methodology for Assessment of Environmental Risk Caused by Fires at Illegal Dumps

It's actually already two month old news, but my research "Developement of the Universal Methodology for Assessement of Environmental Risk Caused by Fires at Illegal Dumps" (download in RUSSIAN), that was made special for Fire Monitoring Challenge (by GIS-Lab, Microsoft, NEXTGIS, several universities and GIS/spatial data corporations), was  awarded the 2-nd pace. The prize consisted of the fancy diploma, Lenovo IdeaPad G560 (thanks to all the gods it became much less uglier when I've installed openSUSE at it and applied an OSM sticker ;-), a wireless mouse (my wife was happy to grab it) and a nice book on remote sensing for children.

Instead of abstract:
Developed methodology for assessment of the fire probability in dependence of spatial location and actual area of illegal dump. It is applicable for any part of the world. Software used: QGIS, R.
Spatial component of the probability of the fire at illegal dump in Leningrad region, Russia

I was lucky to present this research at two conferences and today I've received a printed "minor" publication of the article (it is beta-version of the paper available at the link above). So it is possible now to cite it as:
Yury V. Ryabov (2011) Razrabotka univercal'noy metodiki rascheta veroyatnosti vozniknovenia pozhara na nesankcionirovennoy svalke // Sbornik nauchnih trudov molodyh specialistov, prepodavateley i aspirantov po resultatam provedenia Tret'ego molodezрnogo ecologichescogo congressa "Severnaya palmira", 21-22 noyabria 2011, Sankt-Peterburg. - SPb NICEB RAN - pp. 93-106.
To Do: develope formula for composition coefficient calculation; translation to English; major publication.

P.S. If you are interested in this research and do not speak Russian don't hesitate to contact me and ask for general translation.

Friday, January 13, 2012

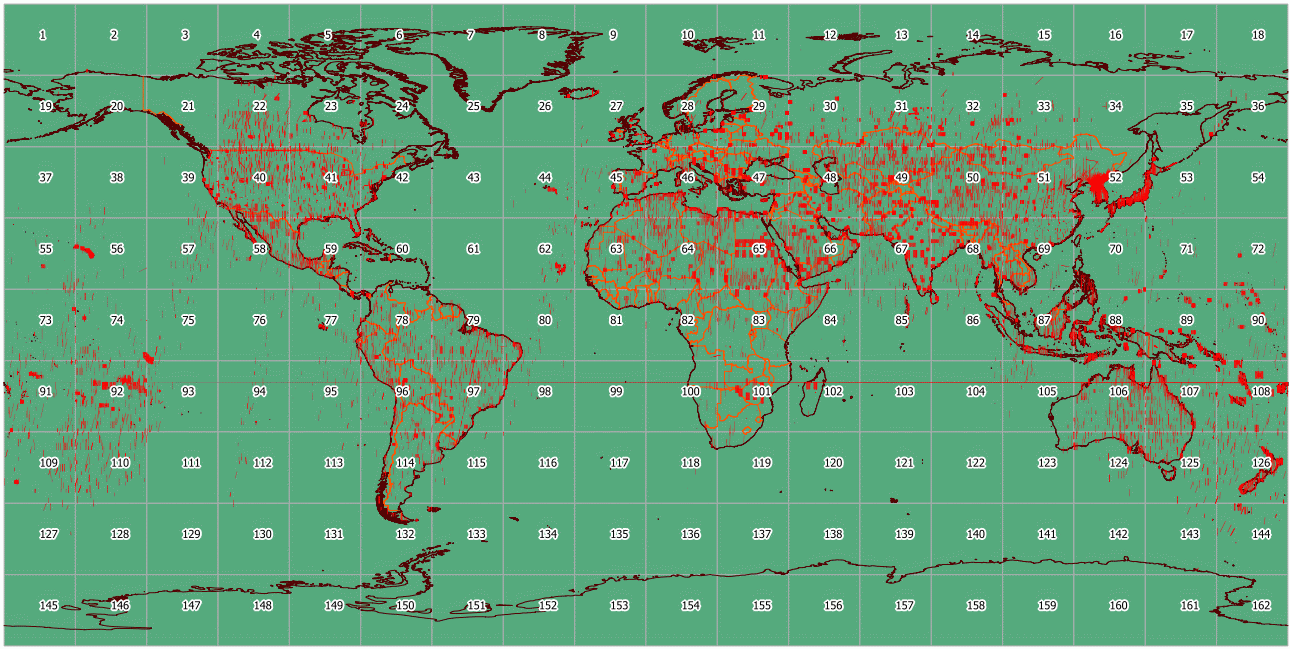
OrbView-3: offline imagery catalogue available

OrbView-3 high resolution imagery became available as a public domain recently. One can access it via USGS's EarthExplorer.

GIS-Lab decided to make a shp-file catalogue for the available imagery to have quick access to the metadata and coverage. You can download it here.


OrbView-3 coverage

PS. I'm glad I was able to help a bit with that.

Thursday, January 5, 2012

QGIS: visualisation of the directions of the roads

I was asked about the possibility to visualise directions of the roads in QGIS. Actually it is quite simple assuming that your data is topologically adequate. That means that the directions of the poly-lines representing one-way roads are the same to corresponding roads directions.

So you need a right layer with a field named like "ONE_WAY" with "yes"/"no" values. Then just check Categorised symbol in New Symbology and classify the layer using "ONE_WAY" field. Obviously you will have 2 categories: one-way and both directions.

For a one-way road create a style lake at the picture below:
Style example for a one-way road

The direction of the line in "Symbol Properties" is from left to the right, i.e. -->. In this stile I used two layers: a simple line and a marker line. An arrow marker is already present in your QGIS installation so you don't need to add anything. Such stile will represent the direction of the one-way roads. Now you only need to assign a stile for the roads wit both directions. For example the same simple line but without marker layer.