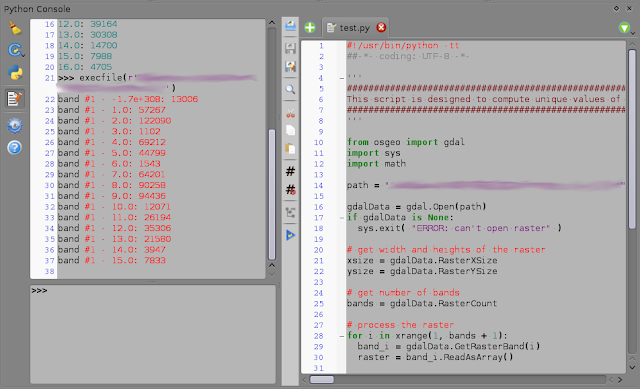
Recently I demonstrated how to get histograms for the rasters in QGIS. But what if one need to count exact number of the given value in a raster (for example for assessment of classification results)? In this case the scripting is required.
UPD: the script below was transformed in more usable SEXTANTE script, see this post.
UPD: the script below was transformed in more usable SEXTANTE script, see this post.
We'll use Python-GDAL for this task (thanks to such tutorials as this one) it is extremely easy to learn how to use it). The script I wrote seems to be not optimal (hence its working just fine and quickly so you may use it freely) due to it is not clear to me whether someone would like to use it for the floating data types (which seems to be not that feasible due to great number of unique values in this case) or such task is performed only for integers (and in this case code might be optimised). It works with single and multi band rasters.
How to use
The code provided below should be copied into a text file and saved with '.py' extension. Enable Python console in QGIS, hit "Show editor" button in console and open the script file. Then replace 'raster_path' with the actual path to the raster and hit 'Run script button'. In the console output you will see sorted list of unique values of raster per band:
 |
| Script body (to the right) and its output (to the left) |
Script itself
#!/usr/bin/python -tt
#-*- coding: UTF-8 -*-

'''
#####################################################################
This script is designed to compute unique values of the given raster
#####################################################################
'''

from osgeo import gdal
import sys
import math

path = "raster_path"

gdalData = gdal.Open(path)
if gdalData is None:
  sys.exit( "ERROR: can't open raster" )

# get width and heights of the raster
xsize = gdalData.RasterXSize
ysize = gdalData.RasterYSize

# get number of bands
bands = gdalData.RasterCount

# process the raster
for i in xrange(1, bands + 1):
  band_i = gdalData.GetRasterBand(i)
  raster = band_i.ReadAsArray()

  # create dictionary for unique values count
  count = {}

  # count unique values for the given band
  for col in range( xsize ):
    for row in range( ysize ):
      cell_value = raster[row, col]

      # check if cell_value is NaN
      if math.isnan(cell_value):
        cell_value = 'Null'

      # add cell_value to dictionary
      try:
        count[cell_value] += 1
      except:
        count[cell_value] = 1

  # print results sorted by cell_value
  for key in sorted(count.iterkeys()):
    print "band #%s - %s: %s" %(i, key, count[key])
No comments :
Post a Comment